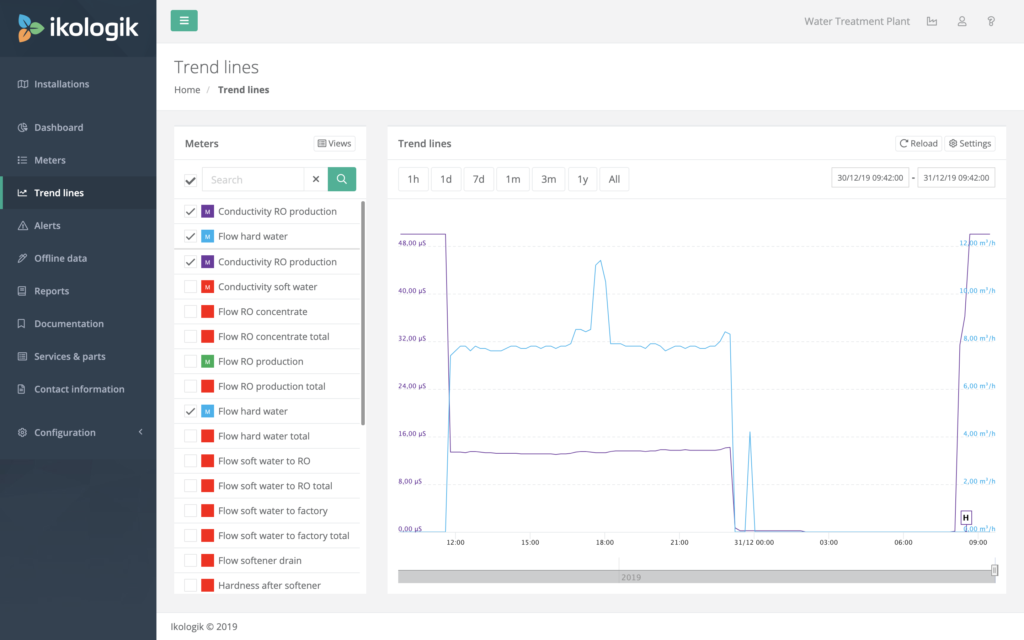
The Trend lines module allows you to browse through the data points of the tags.
On the left side of the module, you can find the tag selection list. On the right-hand side, you can find (from top to bottom) the reload button, the trend line settings, the time range selection, the trend lines and the navigator bar.
Tag selection
By clicking on the coloured box in front of a tag in the tag selection list, you can select/deselect a tag and change the look of the tag’s trend line. We store the user’s tag selection between visits.
Depending on the type of tag, specific options are available or hidden.
| Tag type | Data type | Graph type | Line width | Range | Color |
|---|---|---|---|---|---|
| Value | X | X | X | X | X |
| Incremental | X | X | X | X | |
| Totalizer | X | X | X | X | X |
| Setpoint | X | X | |||
| Boolean | X | X | |||
| Status | X | X | |||
| Alert | X | X | |||
| Offline | X | X | X | X | X |
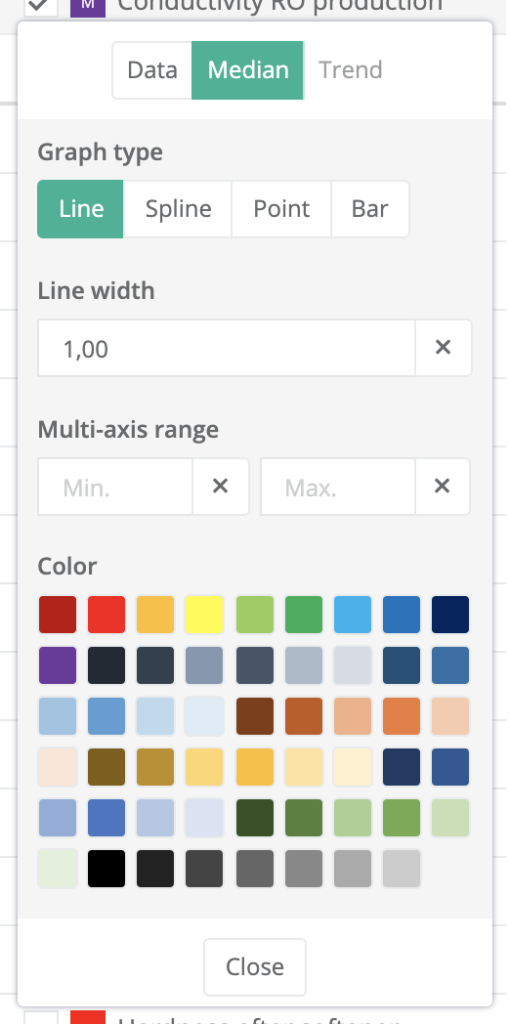
Data type
Three data types are available:
- Data: The data points are rendered without algorithms applied. Depending on the selected range, the data can be optimized.
- Median: A median algorithm is applied to the data. The median algorithm will sort a set of values and display the middle value.
- Trend: A trend or moving average algorithm is applied to the data. The trend algorithm calculates the average of a set of values.
Graph type
Four graph types are available:
- Line: renders a trend line with sharp corners.
- Spline: renders a fluid trend line though the measured points.
- Point: renders a point for each data point on the trend line.
- Bar: renders a bar for each data point on the trend line.
Line width
Changing the width will alter the rendering thickness of the line, point or bar.
Multi-axis range
By setting a minimum or maximum value, the trend line is rendered with a fixed minimum or maximum Y-axis value. If a data point is outside of the configured extremes, it is not visible.
Colour
To render the trend line in a specific colour, choose a colour from the dropdown. The assigned colour is displayed in the tag list as a reference.
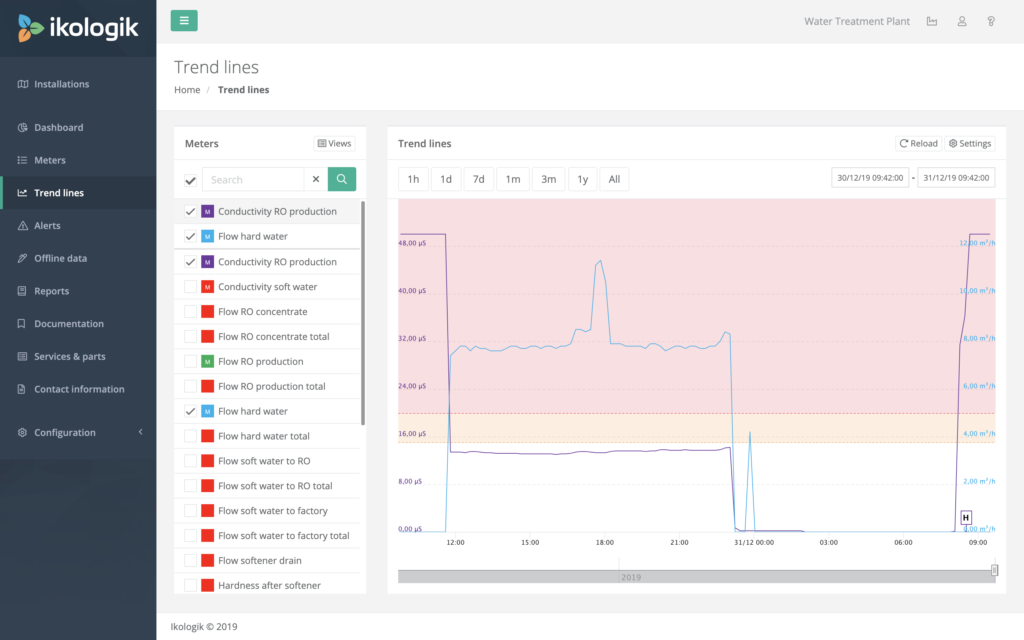
Tag range
When hovering over a selected tag, the configured limits for that tag will be rendered in the graph. This will show you very quickly if measured values are within the expected measurement range.
Views
In most cases, specific tags should be displayed together for analysis. To be able to load a pre-defined set of tags, you can create a view based on the current set of selected tags. A previously created view can be recalled, edited or removed at any time.
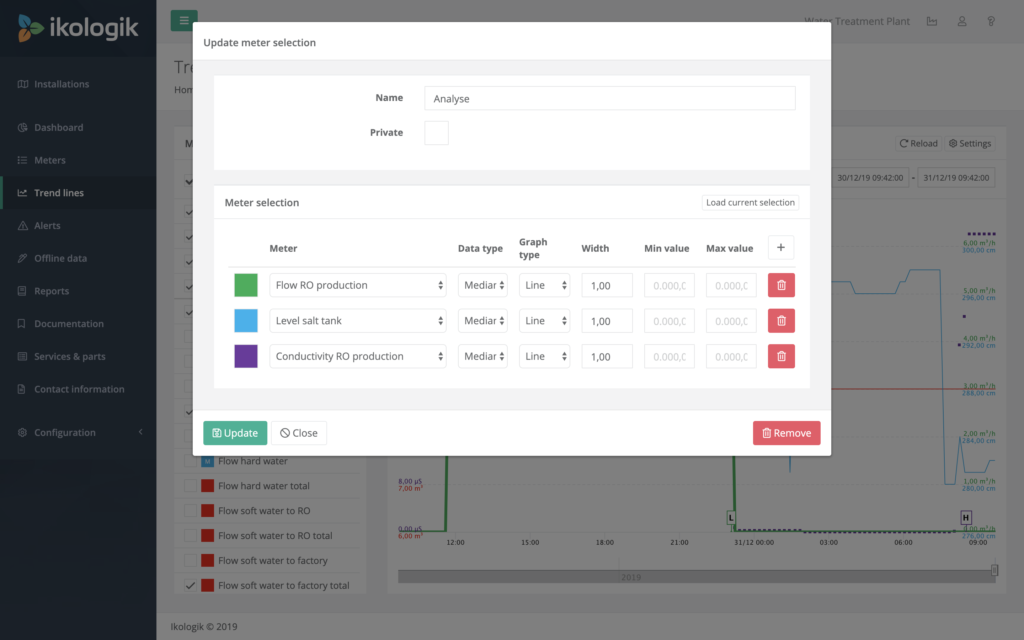
Create a view
- Select the tags you want to display together.
- Click the ‘View’ button on the upper right-hand corner of the trend lines tag list.
- Click the ‘Add’ button on the lower right-hand corner of the dropdown to create a new view. Current tag selection will be automatically loaded in the presented view.
- Provide a name for current selection and press ‘Save’.
Update a view
- Click the ‘View’ button on the upper right-hand corner of the trend lines tag list.
- Click the ‘Edit’ button of the view you want to update.
- Change the configuration of the view.
Remove a view
- Click the ‘View’ button on the upper right corner of the trend lines tag list.
- Click the ‘Edit’ button of the view you want to update.
- Click the ‘Remove’ button on the lower right-hand corner.
Reload
By clicking the reload button, the data points of the currently active time range are reloaded from the server.
Trend line settings
In the trend line settings dropdown, you can change the behaviour of the trend lines.
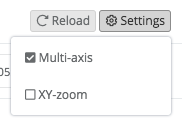
Multi-axis
When active, a separate Y-axis is rendered for each selected tag. This functionality is useful when the selected tags have a data range which has different data ranges. If you want to investigate how the data points of the selected tags relate to each other, it’s better to turn the Multi-axis setting off.
XY-zoom
When active, you can zoom in the X and Y direction by clicking and dragging on the trend lines. When turned off, youcan only change the time range (X) by clicking and dragging on the trend lines.
When the XY-zoom is active, an additional button appears to reset the Y-axis of the trend lines.
Range selection
The visible period for the trend lines can be updated by using the range selection tools. By clicking on the buttons onthe left, the selected period’s duration changes to 1 hour (1h), 1 day (1d), 7 days (7d), 1 month (1m), 3 months (3m), 1year (1y) or all. The end date of the currently active period always stays the same, only the start date of the period ischanged when using the buttons.
The two date fields on the right side, represent the selected time frame’s start and end date. These dates can bechanged manually to change the selected time range.
Trend lines
When tags are selected via the tag selection, the trend lines of the selected tags are rendered. The X-axis always represents a point in time. The Y-axis is the value of the tag uploaded by the data logger at that specific time.
Navigator bar
This navigator bar allows you to quickly choose the desired period you want to display as a trend line. The minimum and maximum markers can be dragged horizontally to change the duration of the selected period. By clicking in the middle of the selected period and dragging to the left or right, you can offset the selected period.